Help With Google Sheets (Not GF Related)

Good morning all. I’m having a bit of an issue trying to get a Pivot Table to do what I want. Maybe it isn’t possible, but I thought I would turn to you guys to see if I’m just missing something. I’ve spent some time searching Google and Youtube and haven’t been able to find anyone trying to analyze the data the way that I am… so there are no examples of trying to use pivot tables in this way that I can find.

This is the source data. Column “One” uses a “Split” operation to generate columns “One” through “Six” using the column “SOURCE”.

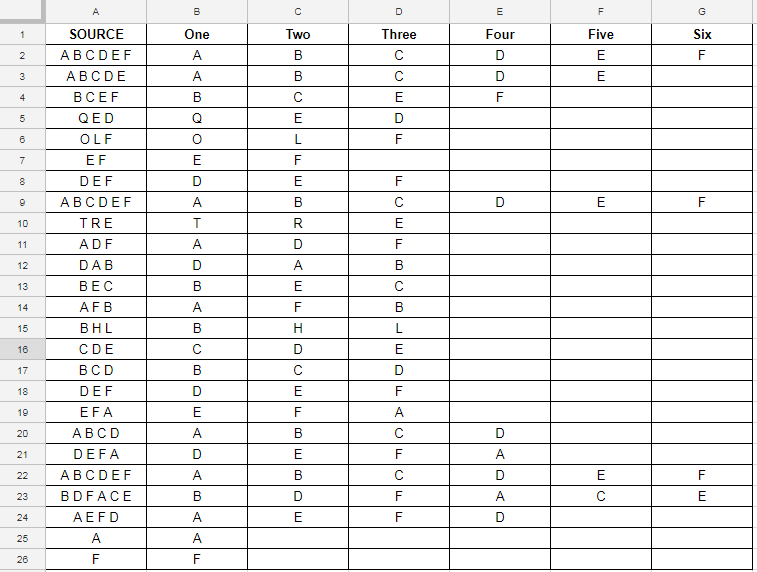
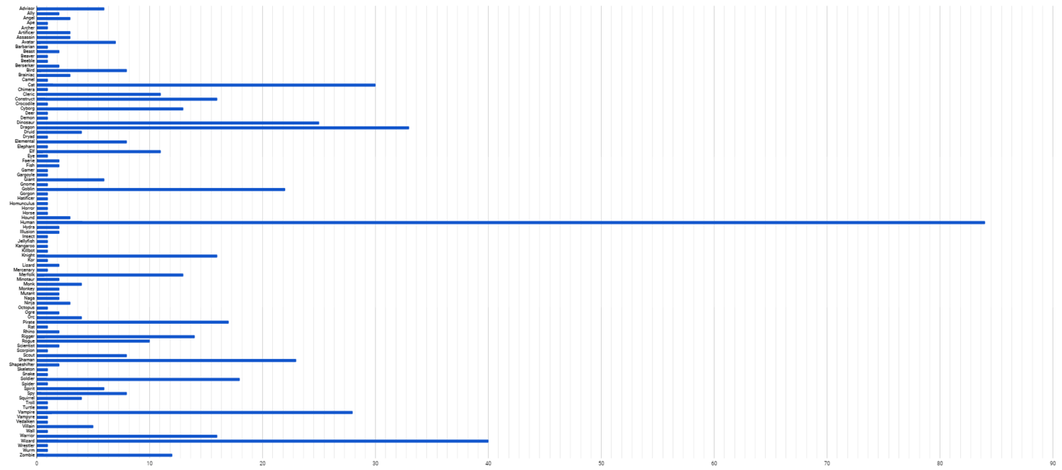
The outcome that I want is for a list of each letter contained in columns “One” through “Six”, and the number of times each of those letters appears in the table (not counting the SOURCE column). This is an example using letters, so in this case I could brute-force this with 26 “Countif” calculations. My real-world example uses words that could be anything, so sadly I can’t take that approach. I thought I could make it work with Pivot tables, but that doesn’t appear to work the way that I want it to. It treats each column as an individual data set. I could use multiple pivots to find the quantity in each column, but not every letter appears in every column, so lining those up to sum the totals seems impossible… Though I suppose I could use VLookup… but again, since the values in each column are words that could be anything…

Here is a link to the spreadsheet. It should be open so that anyone with the link can edit it.

Any help would be greatly appreciated.

1 Like

Does it have to be a spreadsheet?

Also, it would be helpful to see an example of the output you want. I’m having trouble envisioning it from the description.

1 Like

My source data is in a spreadsheet. The output doesn’t have to be. It does have to be something that I can access easily, and I don’t have Office on my home computers… so I’ve been sticking with Google options for all that kind of stuff.

I added the brute-force example to the spreadsheet. In that case I can list each letter, but the real example would not have rows for items that have no quantity. So “G” for example wouldn’t even have a row because it never shows up in the table… but if I added something with “G” to the table later, the list would update with the new item and it’s quantity.

Do you care about the columns, or is it just that you need to count the total number of times each character appears in a list of strings?

1 Like

I couldn’t find a way to break the strings down into their components without using the split command… at least not a way where I don’t have to look for specific words manually. If there are other options then I am definitely open to them.

Here’s an example out of the real data set… It’s a list of creature types in Magic: the Gathering. I have a list of cards, many of those cards with these creature types on them.

“Cat Dragon”
“Dragon”
“Bird Wizard”
“Dragon Wizard”
“Human Cleric”
“Human Wizard”
“Zombie Dragon”
“Monkey Spider Scientist”
“Spider”

The outcome of this data set that I am looking for is:

Bird - 1
Cat - 1
Cleric - 1
Dragon - 4
Human - 2
Monkey - 1
Scientist - 1
Spider - 2

But then, if I later add “Orc Pirate” and “Human Pirate” to the list, the results would update to include that…

Bird - 1
Cat - 1
Cleric - 1
Dragon - 4
Human - 3
Monkey - 1
Orc - 1
Pirate - 2
Scientist - 1
Spider - 2

I have added a proposed solution in Pivot Table 3. See if it works for you.

5 Likes

That appears to do it! Spectacular! Thank you!!!

1 Like

So let me see if I can work out how this actually works.

=transpose(split(join(" ", A2:A26), " "))

Join takes all the text in the range A2:A26 and forms it into one long string using a " " space between each entry. Split then breaks that long string down into it’s individual components, typically represented in a column per item… but then Transpose takes the result and puts it into one column instead.

Genius!

That is, sadly, the simplest plan I could come up with. I was going to hand you a Perl script, but I figured it was easier not to paste your data in and out of the sheet it’s already in.

Another irony is that counting the frequency of words in a document is the standard problem used to explain MapReduce, a famous Google invention. But there’s apparently no easy way to do it in a Google Sheet.

1 Like

Hey, it works.

The only issue I’ve found is that when I add something new, I have to adjust my filters in the pivot table to account for it… no big deal. If I weren’t filtering out some things, then it wouldn’t be an issue at all.

Here’s my data chart from my real-world implementation. It’s a data set of approximately 800 cards.

Check the last tab “tobi sheet” and let me know if that is what you were looking for.

1 Like

It’s looking pretty good, but I think that once the word list is created, a Pivot Table is the way to go to parse that info into numbers.