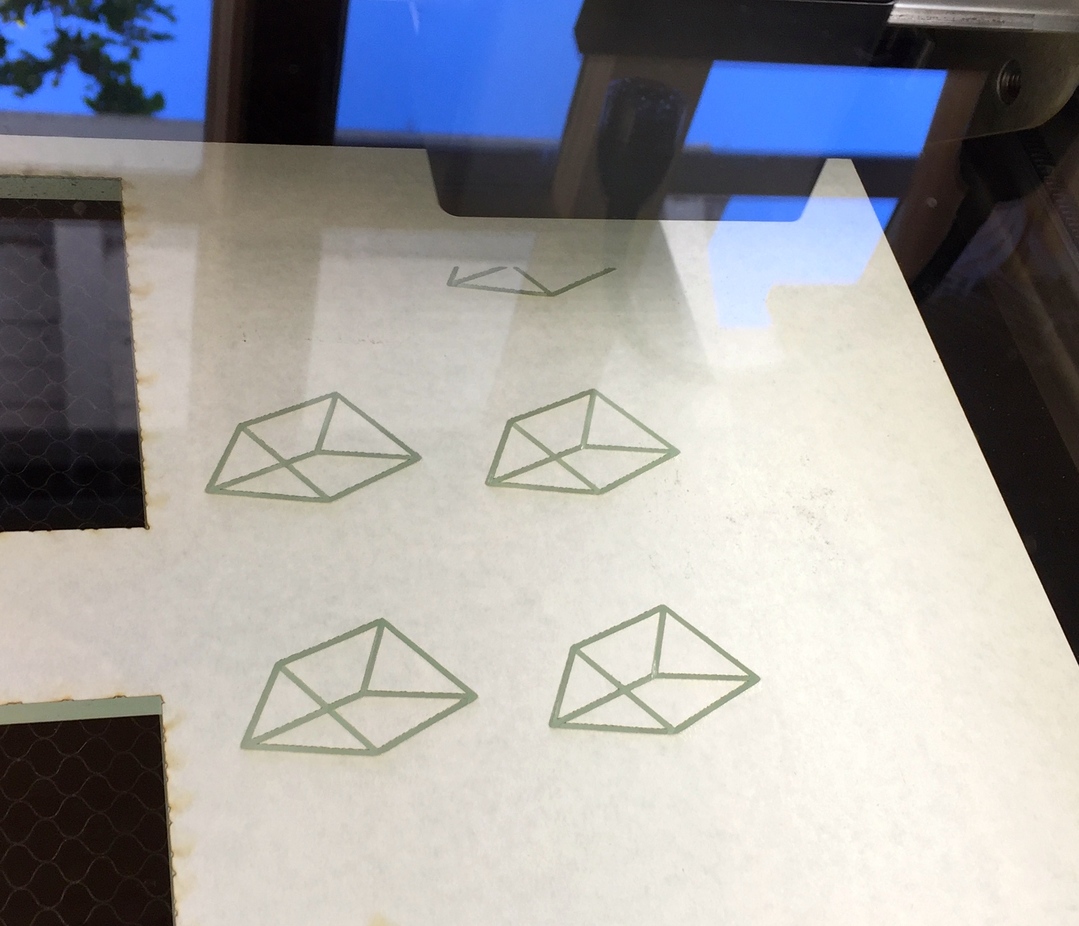
First time it’s happened, and everything finished correctly and just fine, but it was odd, to be sure. Here’s a photo of my actual print job in process;
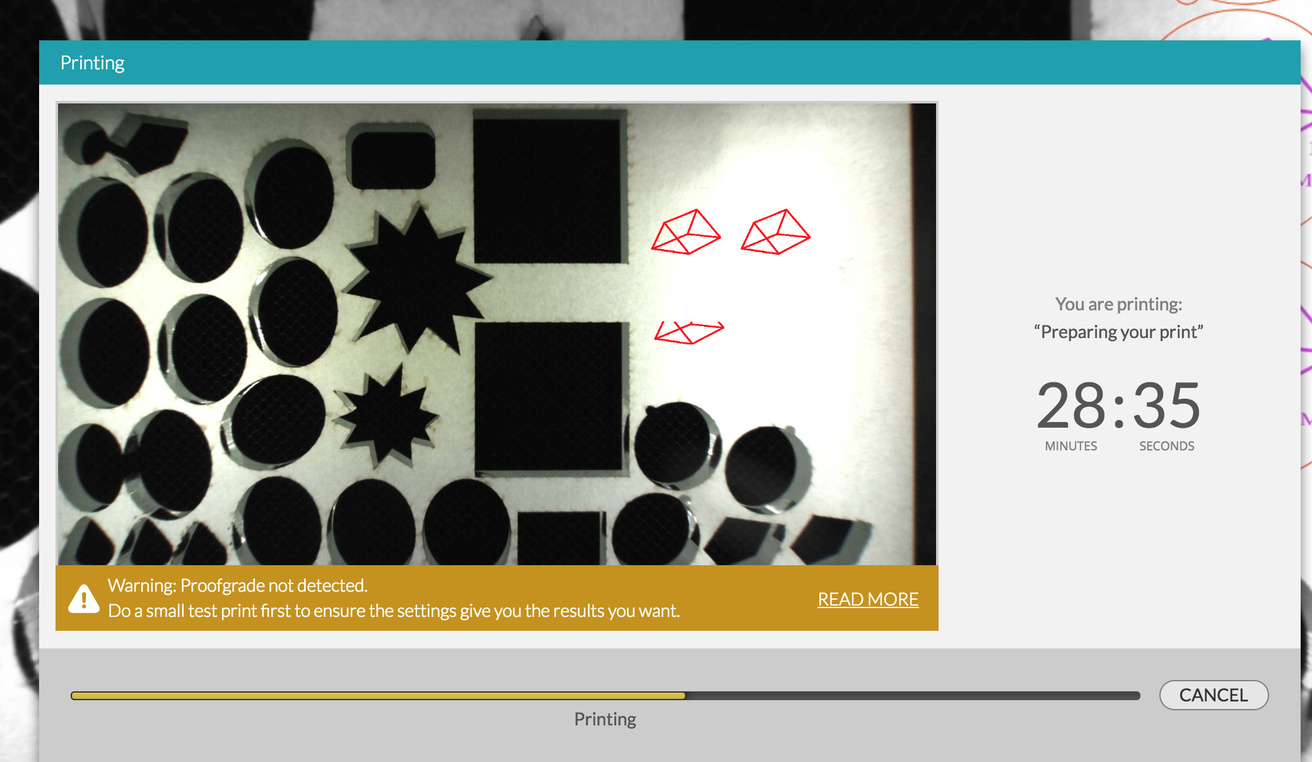
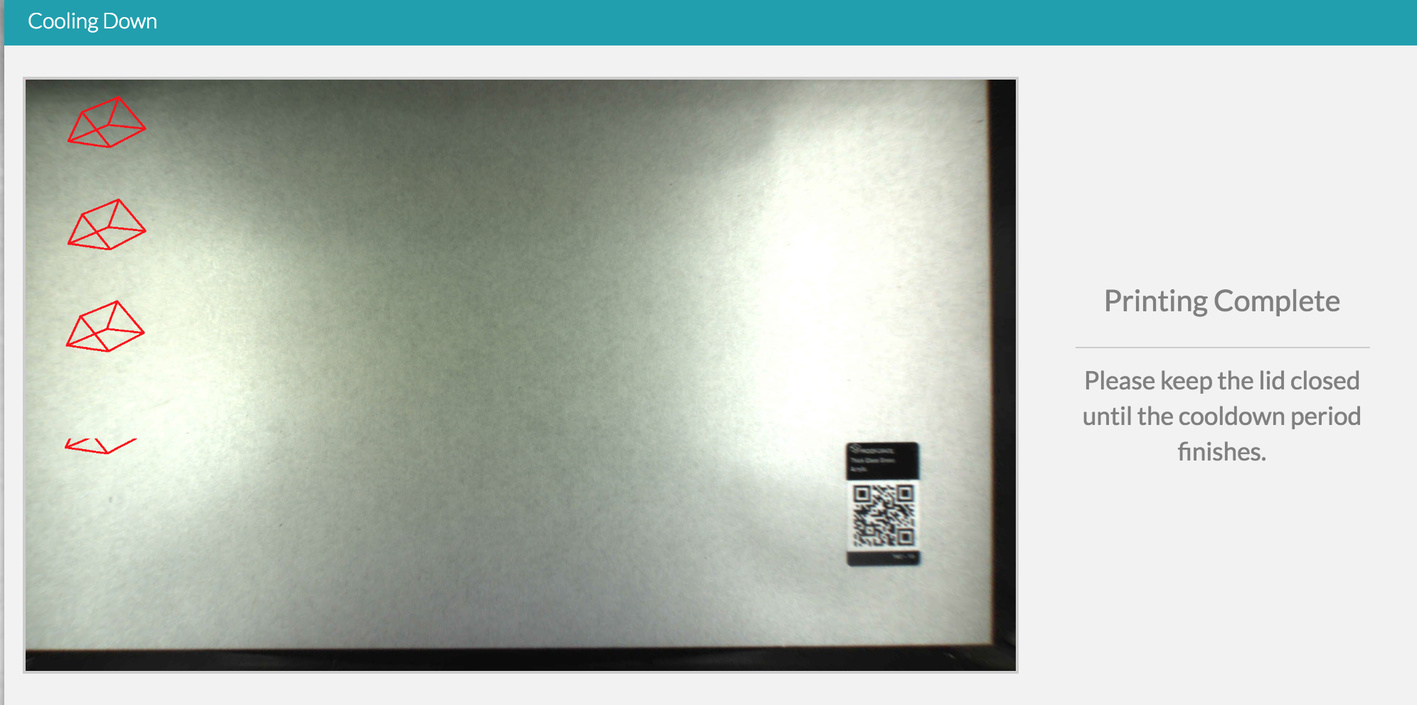
and here’s what was showing on the preview screen while it was running;
I’ve had this happen before, but only when my computer is under heavy load (i.e. I’m running something else in the background), or I switch out of my browser to another app for a long period of time; so, I believe the browser doesn’t update the screen.
Thanks for sharing those screenshots. I’ve passed this on to the team, and I’d be interested in some more information if you run into this again.
If this issue reoccurs, would you please do the following? The instructions I’ve included are for the Google Chrome browser, but just send us an email at support@glowforge.com if you need these steps for another browser.
Keeping your browser and the Glowforge tab open, launch the Chrome DevTools
Click the Chrome menu on the top right corner of the page and choose Tools>Developer Tools
Right-click within the app Workspace and choose Inspect Element
Capture a performance snapshot
In DevTools, click the Performance tab
Click Record
Wait five seconds
Click Stop
Click Download to save the file to your computer
Take a screenshot to capture the data as shown in the sample below
Mac: Press Shift-Command-4 and click and drag a box around your image. You’ll find the screenshot file saved on your desktop.
Windows: Click on the Start Menu and search for the Snipping Tool. Open the Snipping Tool > New then click and drag a box around your image. Click the Save icon and name and save your file.