About a decade ago, I was “into” building high performance systems with overclocked CPUs and water cooling, I was “that guy” who spent $1000 on the latest Intel i7 black edition that was unlocked so that stuff was supported. I managed to get a stable system at around 4.2GHz, which back then was something.
Point is, I’m certain I remember Windows reported individual process utilization as a % of a single core. I’m not afraid to admit I’m wrong, however, because on a good day, I don’t remember what I had for breakfast…
Thanks for your patience. I’ll need a bit more information to continue looking into this. Would you please do the following the next time the Glowforge tab in your browser uses more than 100% CPU?
Chrome:
Keeping your browser and the Glowforge tab open, launch the Chrome DevTools
Click the Chrome menu on the top right corner of the page and choose Tools>Developer Tools
Right-click within the app Workspace and choose Inspect Element
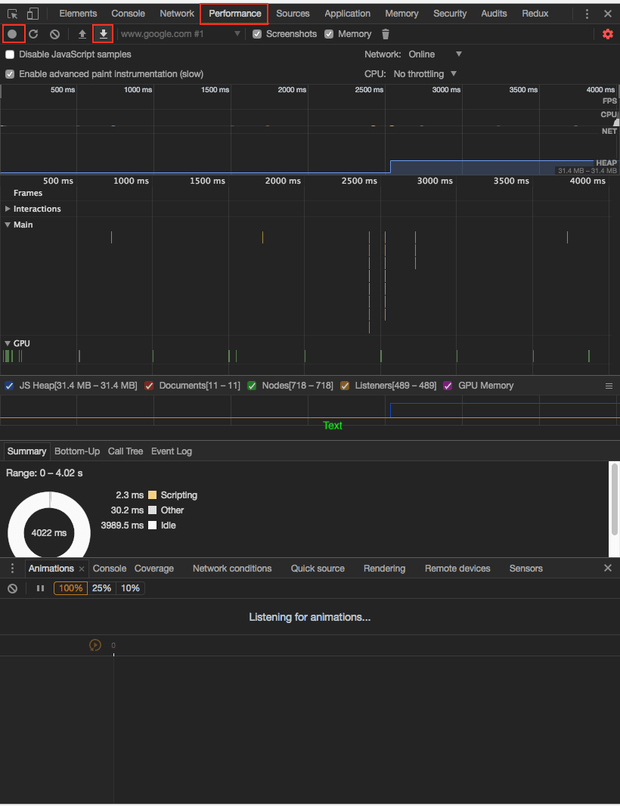
Capture a performance snapshot
In DevTools, click the Performance tab
Click the Record button
Wait five seconds
Click the Stop button
Click the Download button to save the file to your computer
Take a screenshot to capture the data as shown in the sample below
Mac: Press Shift-Command-4 and click and drag a box around your image. You’ll find the screenshot file saved on your desktop.
Windows: Click on the Start Menu and search for the Snipping Tool. Open the Snipping Tool > New then click and drag a box around your image. Click the Save icon and name and save your file.
It’s been a little while since I’ve seen any replies on this thread so I’m going to close it. If you still need help with this please either start a new thread or email support@glowforge.com.