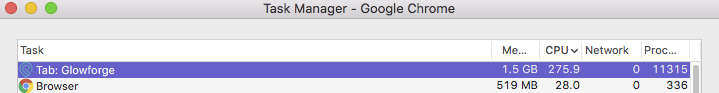
The Glowforge tab in Chrome (latest version) is using 300% CPU (on a 4-core MacBook Pro) while cutting. This seems to be about 299% too high given that it’s not doing much other than monitoring the GF that’s doing all the real work. It’s not happening all the time and I haven’t seen any pattern, but boy is my machine slow when it happens. Since I stay in the same room while the Glowforge is cutting, I use my machine for other things, and this will put a crimp in that.
This may be new; I hadn’t noticed it before. I usually don’t do CPU-intensive things while I’m cutting so may not have noticed, and the GF is loud enough I can’t hear if my laptop fan goes on. I’m in the middle of the biggest job I’ve done in a few weeks, so perhaps this an issue with a recent software update?
The particular job is not complicated. A 12K svg file with 16 cut objects each of which has two etched areas inside it.
I run my Glowforge off of my Mac Mini, and I’ve been getting the same warning message lately as well. Hadn’t gotten it since getting the laser in November, but about a month ago, after an update, it started.
A person or machine doing more than 100% effort is one of my pet peeps. Isn’t it theoretically impossible to do more than 100% of your capability??? 100% in maximum capability.
I would question the programmer who wrote the code saying your CPU is using 300 percent of its capacity, or figure out how they define 100%.
I do CPU intensive work where I run my machine for hours. My solution to figuring out how hard it is working is to put my hand on the machine and see how warm it has become.
Perhaps one of the 3rd-party scripts on the site is now mining Bitcoin…
Since you’re using Chrome, you could open the Developer Tools from the menu and record a performance audit from the “Performance” tab. That might show you where the excessive CPU usage is coming from.
Or, you could block almost every script and extraneous site using tools like Privacy Badger and uBlock Origin (I’ve blocked almost everything and I can still cut fine). Then, if the excessive usage has gone away, turn scripts back on one by one until it comes back.
Once cutting is started, I’m pretty sure you don’t even need the computer to control anything. Assuming you don’t have to do any follow up cuts (ex other side of the same part), you can just close the tab, the browser, or even the whole computer.
Is this is an attempt at humor? CPU usage is measured in terms of a single core. No other way is consistent. My 300% on a 4-core CPU is three times the 100% on a single-core CPU or an 8-core CPU at the same clock speed. It’s not 75%.
I am cutting the same thing multiple times with the same settings. As far as I know, I must keep the window open for that to work (when I return to the app, it does not show the bed until I add a new design). Aside from that, I like knowing and seeing the progress without setting an external time. It’s still a problem even if I can avoid it.
With browsers that auto update, like Chrome does, this isn’t always useful. My current version is 66.0.3359.117, which it looks like got on April 26th (Thursday) from the Stable channel. On Friday, Google announced the release of 66.0.3359.137 to the Stable channel. whatismybrowser reports that the latest Stable release is now 66.0.3359.139. I’ll update to .139 when I next restart Chrome. With at least 3 releases in as many days, it is simply not possible for Glowforge to test with all of them, nor is it possible (AFAIK) to get installers for every single incremental release of Chrome. Someone would have to be constantly scraping for new installers and I do not know any site that does that.
If you were serious when you posted this comment, you might want to sit down before you hurt yourself. Ever since multiple cores in a single system has been possible, process utilization has been measured in terms of core usage, going back at least 25 years (when I first started coding on multi-core systems).
Roy: My 8-core system also reports one of the browser helper processes consuming ~300% while showing the print progress dialog, but if I close it by simply clicking back on the GFUI main window (it’s not needed anyway), it drops back to expected levels.
I suspect there’s some kind of continuous polling taking place. Ugh… just realized, I should probably check network activity. Stay tuned!
OK, it’s not network - very little happening there. I do note that if I exit the progress dialog, the process itself is still there but runs at very low (normal) CPU utilization.
That’s an interesting data point and may be useful to the dev team. It is distinctively different than if your 8-core system were at 700%. Is your system also a Mac and also Chrome?
On network, I expected it to be non-0, but, as the snapshot shows, network traffic is minimal, probably just getting updated positions periodically. After all, the camera is not showing the head moving. So what is it doing with the 300% CPU?
Only thing being communicated should be the basic status info for display. The countdown timer and progress preview display would continue to run if communication was lost with the GFUI. No clue how much processing involved in processing the motion file for display.
Of course that’s just an assumption from operations experience. Haven’t looked at any of the network traffic.
I was referring to individual process utilization numbers, not overall system load, but I booted up an old Win10 virtual machine and see it does indeed do it differently.
Just an FYI here, if a thread were waiting on network I/O it would be in a sleep state not active CPU state. More specifically it would effectively be using 0% CPU.
@eflyguy is correct. However, as @palmercr said windows shows CPU as a single normalized value.
On all systems, these values are tracked at an extremely low level and any values that you view are likely computed. Take a look at macOS and *nix systems. They track core usage, measured in jiffies, using the following buckets to track time spent:
user: normal processes executing in user mode
nice: niced processes executing in user mode
system: processes executing in kernel mode
idle: twiddling thumbs
iowait: waiting for I/O to complete
irq: servicing interrupts
softirq: servicing softirqs
taking this data and computing the CPU as a percentage is as follows:
Total CPU time since boot = user + nice + system + idle + iowait + irq + softirq + steal
Total CPU Idle time since boot = idle + iowait
Total CPU usage time since boot = Total CPU time since boot - Total CPU Idle time since boot
Total CPU percentage = Total CPU usage time since boot / Total CPU time since boot X 100
Windows has different metric names, though the math is similar. The values displayed in Activity Monitors are not very useful for diagnosing performance issues, they are just there as a heads up that an application may be (0% CPU does not mean idle) doing something, which is very likely an indication of proper operation.